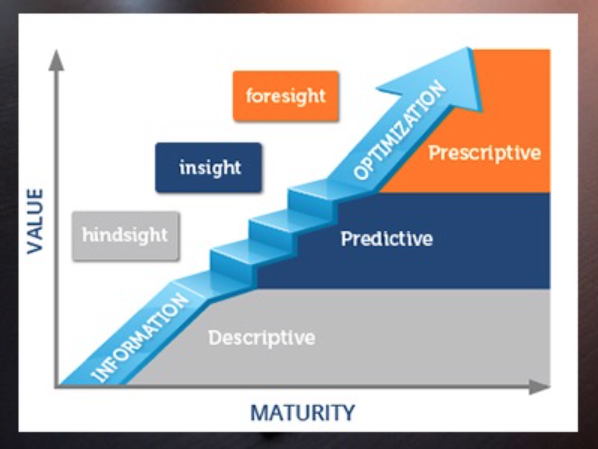
Along with INFORMS, Gartner, Forrester and many other industry analysts have similar versions of these definitions. The curve defines the maturity level of an organization as its ability to gather, analyze and use data to make decisions.
Figure 1: Analytics Maturity Curve from INFORMS

At the bottom of the value axis, descriptive analytics looks into history, and defines how well a business can understand what is happening; a valuable advantage, it does so with sufficient agility and clarity. Traditionally called “BI” (business intelligence), Descriptive Analytics allow users to access reports, interpret data and visualize that data in different ways.
This helps users understand what happened this morning, last week and last month, as well as performance against their objectives. With this information, users can drill into where performance is above or below plan and address the likely causes.
In the middle tier of the value axis, predictive analytics uses statistical data to look forward and obtain additional meaning out of historical information. It analyzes data patterns to find correlations between variables, and uses these correlations to create forecasts or identify anomalies that need to be evaluated, such as fraud detection.
From a forecasting perspective, predictive analytics is best at projecting the behavior of individual variables – such as demand, interest rates or the price of oil – but it does not tell users what to do about it.
At the top of the value axis, prescriptive analytics is entirely forward-looking. It provides a recommended course of action among multiple possibilities, which meets certain sets of objectives subject to physical, financial, policy or regulatory constraints. The most common science underpinning prescriptive analytics is optimization (linear programming).
A typical optimization model may include 250,000 equations, with as many variables in each equation, and consider thousands of decision possibilities to find the “best” answer. There are multiple variants of optimization, which can be associated with simulation (typically Monte Carlo) to evaluate recommendation resiliency under uncertainty.
Should you want to find out more about each of these approaches, such as when to use or not use each of these analytics, or for review examples, please read Andre Boisvert’s paper on Business Analytics published on the River Logic website.
Interpreting the Analytics Maturity Curve for Adoption Strategies
A common misconception is that companies must start at the bottom and move up the curve when they have achieved proficiency in each layer. This IT-driven “layer by layer” strategy has been adopted by the majority of organizations, and the result is a significant amount of value left on the table. This creates a struggle for IT managers in motivating business users to keep data cleaned and refreshed in their data warehouses.
Why does this happen? The simple answer is the data value is not being realized, as business users still have to apply spreadsheets to evaluate data implications. Even a very large spreadsheet is a massive oversimplification of reality, and therefore much of the data ends up unused. It shouldn’t be a surprise that business users don’t spend their time cleaning and refreshing data that provides no immediate value.
The better approach is to adopt analytics from a business angle and “vertically” focus on the most important decisions first (i.e. integrated business planning, pricing, workforce planning, etc.). To support each decision, companies should implement a combination of descriptive, predictive and prescriptive technologies – i.e. understand actuals, compare against plans, make predictions about what might change, and optimize a plan with the proper amount of what-if scenario analysis.
The technologies and data are subservient to the decisions and frequency required by the business. Thus, business people are directly involved, and only necessary data will be cleaned and refreshed. This approach directly contributes to smarter, more agile decision making, and wider adoption of technologies and processes.
The vertical approach does not imply that a companies must adopt a different technical architecture for each type of decision; rather, that it is deployed decision-by-decision, as opposed to layer-by-layer. The vertical approach is business-driven and supported by IT, working backward from required decisions to the types of analytics and support data. The approach ties directly to improving business outcomes, data understanding and decision-making agility.
IT managers can still select the target architecture and ensure each deployment adheres to their standards – though IT managers are encouraged to consider the differences between a system of record vs. a system of differentiation, and even a system of innovation, as defined by Gartner’s Pace/Layer research.
Ask yourself: does my company have an IT-driven, layer-by-layer analytics approach, or a business driven, vertical approach to analytics?


