There are numerous external factors that cause companies to alter their supply chain networks. Trade agreements, such as the new Trans-Pacific Partnership (TPP), will eliminate many tariffs on goods made and sold between the 12-member countries. This pact will trigger tens of thousands of companies to take advantage of it, as the North American Free Trade Agreement (NAFTA) did in 1994 when many US manufacturing companies moved operations just south of the border in Mexico.
Regardless of the reason, the key to optimal logistics planning remains a combination of well-defined processes and easy-to-use technology, where alternatives can be analyzed thoroughly with speed and flexibility, and where fully-informed decisions can be supported by proven prescriptive analytics methods.
Enterprise OptimizationTM Must Remain the Goal
When changes to a company’s supply chain are driven by internal strategy, it can be easier to evaluate the entire network holistically. However, when external forces act on a company’s supply chain, it can be much more challenging due to the pressure to make quick decisions.
Management must resist the urge to view their network myopically as a set of separate locations connected by material flows. Focusing on one geography, for example, can lead to missed opportunities.
For example, I once consulted for a company that had decided no manufacturing plant in the Western US should ship product east of the Mississippi. By quantifying and analyzing the impact of removing such a policy, the company was able to realize additional profit opportunities.
The company’s management must ensure that all tactical and strategic supply chain network decisions are based on optimizing profit across the entire enterprise. Not just at a local, country, or regional level, but the entire organization. By quantifying the impact of alternative choices and then translating them into easily understood financials such as a Profit & Loss Statement and Cash Flow Statement, each one can be objectively compared against the company’s stated goals. The best decisions will always be made with the best available information at the time.
Most supply chain network design tools, however, consider only costs and a few key metrics like average capacity utilization. If optimization techniques are used, it becomes a cost minimization problem. Larger and more important considerations, like product mix optimization and customer profitability, are virtually ignored. While logistics is a key component of a company’s supply chain, it is but one component in an Integrated Business Planning (IBP) context. Enterprise optimizationTM must always remain the goal.
Enterprise Optimization must always remain the key focus in effective logistics modeling.
Example Supply Chain Network Optimization Model
In my last blog entry on logistics modeling, I promised to describe an example supply chain optimization network model and what it was used for. To keep this short, only highlights will be discussed.
The software used in this model was River Logic's Enterprise Optimizer 8.5.1 Developer. I won’t go into detail here regarding the mechanics of how to drag and drop icons onto the diagram, link them together, add a map, add labels and perform other customization steps.
The model is of a hypothetical distribution network for a large, multi-national corporation looking to consolidate freight movement into certain DCs geographically.
The data dimensions are as follows:
- Number of countries represented = 37
- Number of manufacturing locations = 10
- Number of DC locations = 20
- Number of products = 10
- Number of orders = 31
- Number of order/product combinations = 95
The purpose of this model was to first create a baseline to model the current network, and then to run a what-if scenario to analyze if the company should open a distribution center in Singapore.
Process flow diagram
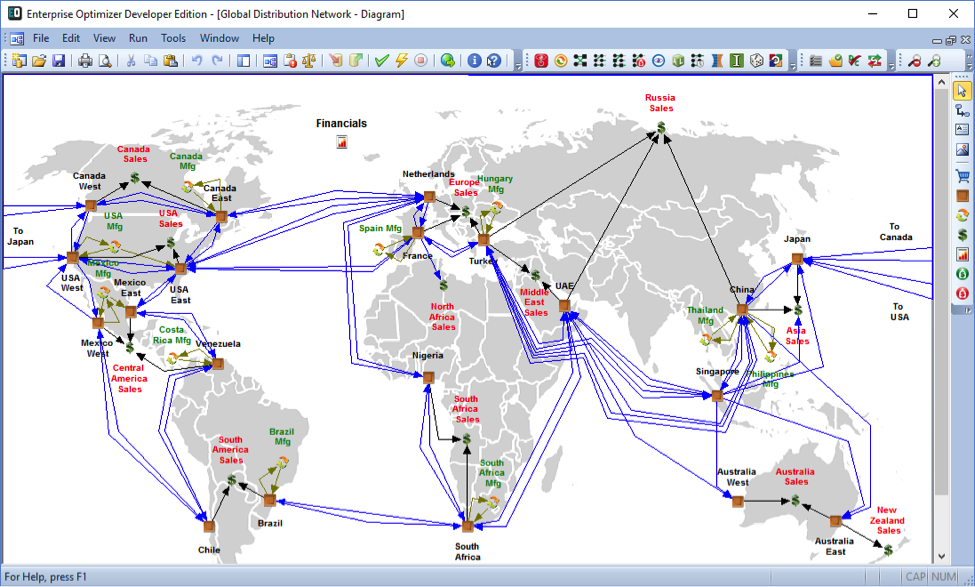
The picture below displays the process flow diagram. A series of nodes represents procurement, manufacturing (include BOMs, yields, etc.), warehousing, distribution, and sales. It is multi-model, as product can be shipped by ocean freighter, truck or rail. The local operations in the receiving country pay for freight and VAT tax is incurred based on the transfer price between from/to countries, and the tax rate for the receiving country.
Financial flow diagram
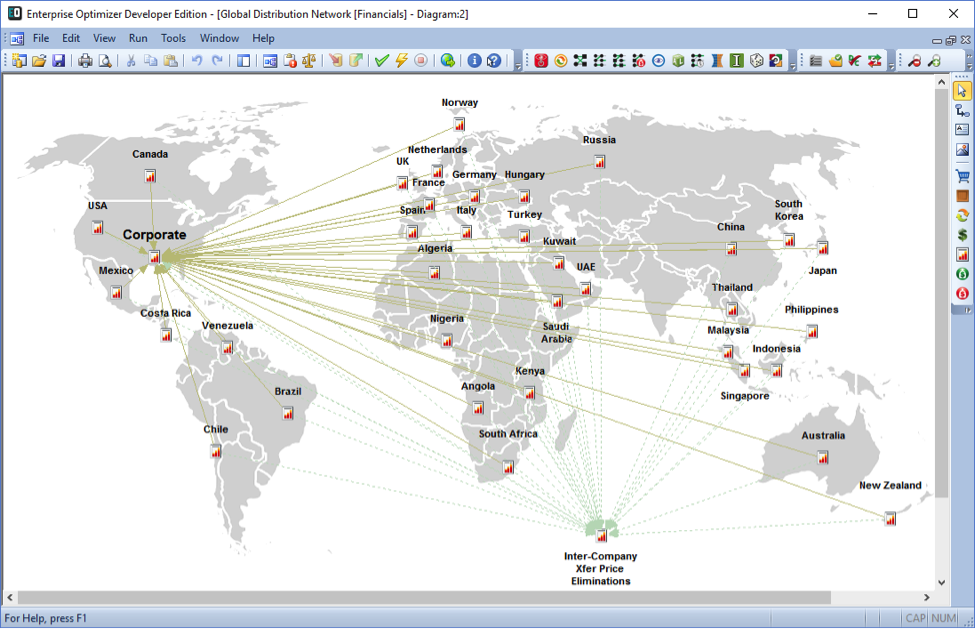
By double-clicking on the ‘Financials’ icon in the first screenshot, a second map appears displaying the financial flows resulting from the distribution network in the first screenshot. The financial flows are driver-based, meaning that the actual cost or revenue of each activity is allocated to one or more GL accounts. The accounts are then used to construct a customized P&L, balance sheet, cash flow statement and other financial ratios. Note, inter-company transfer price eliminations are included to accurately report the overall enterprise-wide profit.
When the model is solved, the solution simultaneously considers all process and financial decisions. This might involve solving for multiple objectives simultaneously, including satisfying customer deliveries on time, optimizing on Net Present Value and many of other options.
Evaluate open/close decisions by location
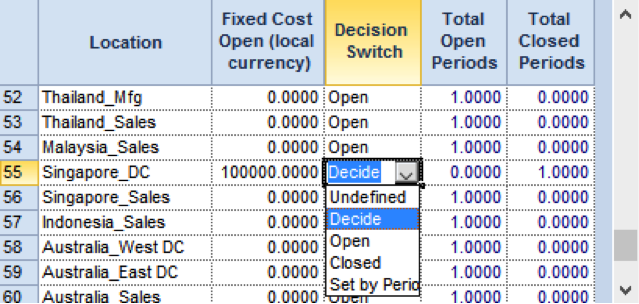
A scenario was created to consider if the company should open a new DC in Singapore, and what would be the resulting impact on the company’s supply chain network. The baseline run excluded any consideration of moving goods through Singapore (i.e., it was “Closed”). To enable this decision, the built-in drop-down value was set to ‘Decide’ and a startup cost of 100000 Singapore Dollars was added.
Customized P&L statement
When the model was solved, all network alternatives and trade-offs were considered. This includes that some shipments through the proposed DC would require additional movement with transportation and handling costs, but that the company might benefit from a lower VAT tax rate in Singapore.
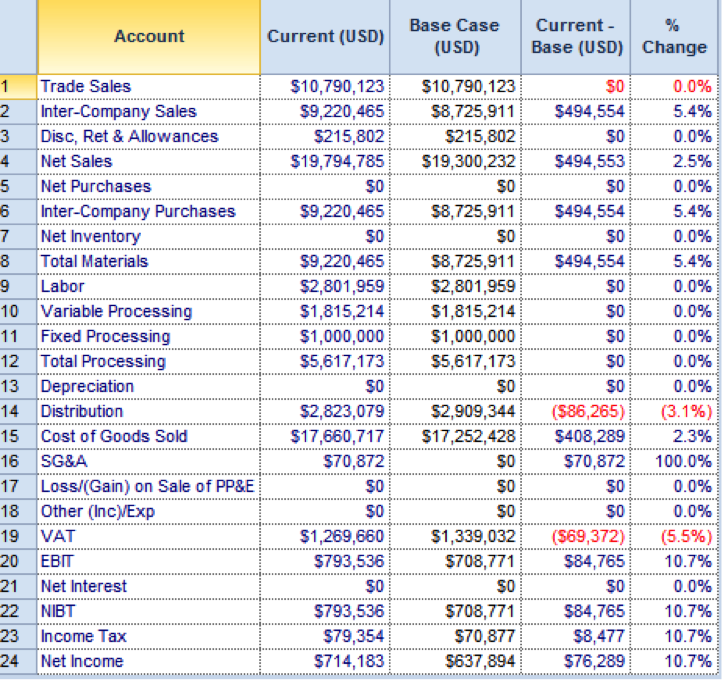
The P&L Statement above displays the difference between the scenario and the baseline (current). It was found that, by opening the Singapore DC, costs were reduced for distribution and VAT taxes, although they increased for SG&A (startup) and income tax. The net result is a 10.7% increase in Net Income.
Speed and Flexibility is Key
If you remember anything from this blog, please remember this – the example model described was built from scratch, data populated, financial accounts customized, and scenario run in just one week.
Plus, there are many additional scenarios that can be considered from the model, including:
- Supply planning – Which products to make? Which countries should each product be sourced from? Which suppliers to buy materials from?
- Distribution planning – Where to open additional DCs? Which DCs to close? What is the optimal inventory level at each DC?
- Load planning – How to best load each shipping unit (container/truck/box car/etc.)?
- Cost-to-serve – How to organize distribution and inventory operations to best serve each customer?
- Reverse logistics – How to track net value of returns (e.g., detailed unit costing, etc.)?
- Demand planning – What is the impact when product mix changes? What is the true profitability by customer? By order? By product?
If evaluating supply chain network design planning tools, consider only those technologies that offer complete flexibility and customization. The best software will allow you to quickly model your existing network, and then allow you the ability to analyze nearly any what-if scenario that needs considering, all-the-while keeping the company’s stated profitability goals in mind.


